
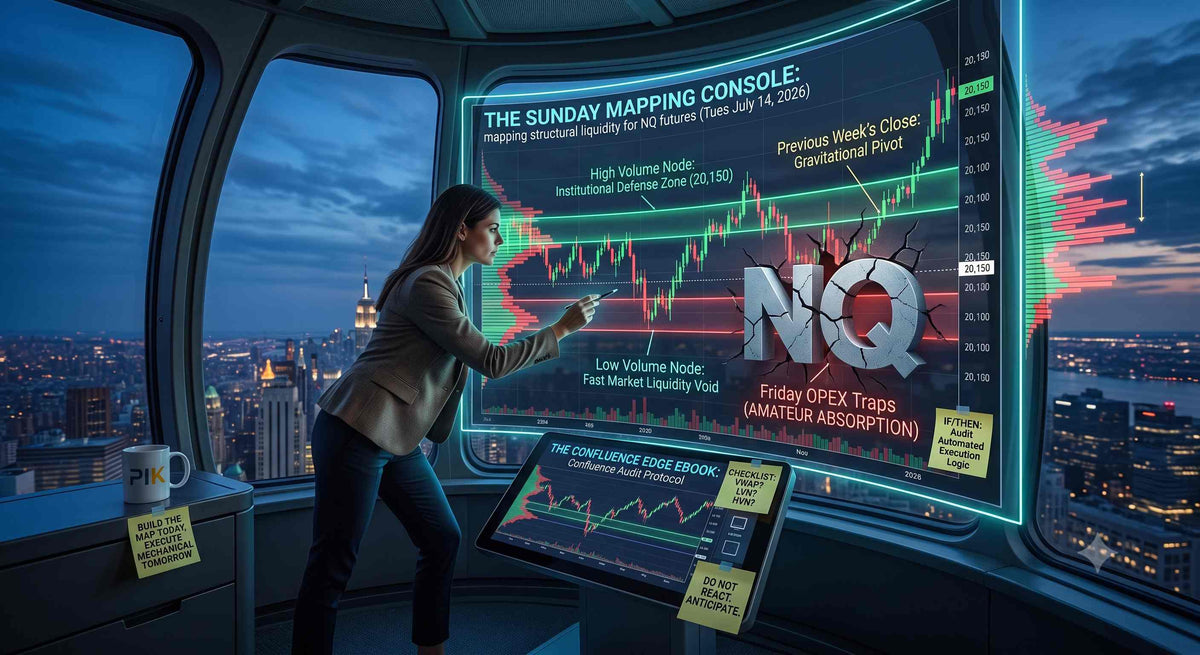
Happy Sunday, July 19, 2026. The institutional servers are currently powered down, the chaotic algorithmic wicks of Friday's OPEX meat grinder have finally stopped printing, and the market is enjoying a brief, mandatory moment of silence. Right now, across the globe, the amateur retail crowd is doing one of two things: they are either actively ignoring the market to suppress the trauma of last week's losses, or they are desperately counting down the hours until the Sunday night Globex session opens so they can blindly gamble on a low-volume breakout. Professional day traders, however, are doing neither. They understand that Monday morning’s profits are exclusively manufactured on Sunday afternoon. If you plan on logging into your brokerage account tomorrow at 9:28 AM, glancing at a 5-minute chart of the Nasdaq, and randomly guessing which direction the wind is blowing, you have already lost. It is the financial equivalent of showing up to the first tee box of a championship golf course with a hangover, no scorecard, and just swinging your driver as hard as you can into the woods. The market will gladly take your green fees. Today, we put down the clubs and build a map.
Quick Answer Amateur traders react to the market on Monday; professional traders anticipate the market by mapping it out on Sunday. By identifying structural liquidity zones, high-volume nodes, and supply/demand imbalances while the market is closed, traders remove the emotional burden of mid-week decision-making and transition to a highly mechanical, business-oriented execution model.
The Underwriting Mentality: Treating your chart like a business
Think about the rigorous logic required in real-world asset management. If you were underwriting a 70-unit multifamily real estate acquisition, you would never wire millions of dollars to a seller just because the building's exterior looked decent on a Tuesday afternoon. You would spend weeks buried in the proforma. You would map out the historical cash flows, project the downside risk, model the debt-service coverage ratio, and mathematically calculate exactly where your breaking point is if occupancy drops.
Yet, when retail traders open their E-mini Nasdaq (NQ) charts, they completely abandon this core business logic. They throw thousands of dollars of highly leveraged capital at a flashing green candle simply because they feel a surge of FOMO. Day trading is not a video game; it is a specialized discipline of risk aggregation and capital deployment.
Your Sunday routine is your underwriting period. Because the candles are frozen, your brain is no longer hijacked by the dopamine of moving prices. You can look at the historical data objectively. This is the only time during the week when you can look at the battlefield from 30,000 feet and clearly identify where the institutional hedge funds left their footprints, where the retail stop-losses are clustered, and where the high-probability execution zones actually exist.
Mapping the Minefield: Locating institutional volume nodes
The single most important task on your Sunday checklist is identifying where the "smart money" transacted heavily during the previous week. Institutions cannot hide their size; when they buy or sell massive blocks of inventory, they leave a permanent volume signature on the chart.
To map this, you must strip away all the lagging, time-based indicators from your layout. Delete the MACD, delete the stochastic oscillators, and clear off the cluttered trendlines. Pull up a Volume Profile indicator on your primary chart. You are looking for High Volume Nodes (HVNs)—the specific price levels where the chart spent the most time and transacted the most volume. These nodes act like gravitational black holes during the upcoming week. Because institutional capital is heavily concentrated at these levels, they will aggressively defend them.
Conversely, you also need to identify the Low Volume Nodes (LVNs). These are the areas where price violently spiked or crashed through with very little friction. If the market approaches these levels on Tuesday or Wednesday, you know mathematically that there is no structural support to stop the price from sliding. By drawing hard, horizontal lines across these specific volumetric zones on Sunday, you are literally painting a map of where the market will stall, reverse, or accelerate in the days ahead.
Defining your Confluence Edge before the bell rings
Once you have mapped out the structural liquidity of the market, you must formalize the exact conditions that will permit you to risk your capital. This is where The Confluence Edge Ebook transitions your trading from a reactive hobby into a highly structured mechanical sequence.
Confluence simply means waiting for multiple, independent technical factors to align at the exact same price level. A single moving average crossover means nothing. A random Fibonacci level means nothing. But what happens if you find a major institutional High Volume Node that aligns perfectly with a higher-timeframe demand zone, and it sits exactly on the previous week's closing price? That is structural confluence. That is an area where smart money has a vested interest in stepping in.
On Sunday, you take the framework from the Ebook and write down your "If/Then" statements. "IF the NQ drops to the 20,150 volume node, AND it prints a rejection wick on a 15-minute timeframe, THEN I will execute a long position with a 15-point stop-loss." You write this script down today so that when the market actually hits 20,150 on Wednesday morning, you aren't crippled by fear or indecision. You simply execute the business plan you already underwrote.
Programming the Execution: Why NinjaTrader 8 dominates the workflow
Having a theoretical map on a piece of paper is great, but executing that map in an environment dominated by high-frequency algorithms requires industrial-grade infrastructure. If you are serious about treating day trading like a legitimate quantitative business, Sunday is the day you audit your backend logic and ensure your automated execution strategy algorithms are properly compiled.
This is why professional futures day traders overwhelmingly migrate to a C#-based architecture like NinjaTrader 8. Retail web platforms are fantastic for buying a few shares of an index fund, but they completely fall apart when you need to run custom technical indicators and complex, tick-by-tick non-time-based data filtering.
On Sunday afternoon, a professional is not just drawing lines; they are verifying that their custom chart style scripts and automated alert systems are firing correctly. They are setting up their workspaces so that if a specific structural confluence zone is breached during the London session at 3:00 AM, the system will instantly route an alert to their phone or directly execute a pre-defined micro-contract position. When your backend logic is fully integrated and tested on Sunday, your platform acts as a flawless, emotionless employee for the rest of the week.
Protecting the Mental Capital
Day trading will drain your mental energy faster than any other profession on earth. The constant decision fatigue of staring at flickering charts will eventually cause even the most disciplined trader to crack and make an impulsive, account-destroying mistake.
The true purpose of the Sunday prep session is to heavily front-load the cognitive labor. By doing all the heavy analytical lifting while the market is closed, you preserve your finite willpower for when it actually matters: trade execution and risk management. When you wake up on Monday, your only job is to sit back, watch the price approach your pre-mapped zones, and pull the trigger when your confluence checklist says yes. Stop guessing. Build the map today, and let the amateurs walk into the minefield tomorrow.
Frequently Asked Questions
What is a Volume Profile and why is it important?
Volume Profile is an advanced charting study that displays trading activity over a specific time period at specific price levels. Unlike traditional volume bars at the bottom of a chart that show when trades happened, Volume Profile shows where they happened, revealing the exact price zones where major institutional capital is heavily invested.
What is a High Volume Node (HVN)?
A High Volume Node is a peak in the Volume Profile representing a price zone where massive amounts of historical buying and selling occurred. Because smart money has a large vested interest in these areas, HVNs naturally act as powerful, gravitational support and resistance zones.
How does mapping the chart on Sunday prevent emotional trading?
When the market is open, the rapid movement of prices triggers fear and greed. By analyzing the market on Sunday when prices are frozen, traders can make cold, objective, mathematical decisions about where to enter and exit. This creates a rigid "If/Then" business plan that removes mid-week emotional guesswork.
What is structural confluence?
Structural confluence occurs when multiple, independent technical indicators or historical price metrics (e.g., an HVN, a VWAP band, and a higher-timeframe support level) all align perfectly at the exact same price point. This alignment dramatically increases the probability that a trade setup will be successful.
Why is NinjaTrader 8 preferred for professional execution?
NinjaTrader 8 is built on a robust C# framework designed specifically for futures markets. It allows for the integration of custom algorithmic execution logic, non-time-based charting capabilities (like pure Renko or Tick charts), and zero-latency order routing that traditional retail web brokers cannot support.
What are "If/Then" statements in a trading plan?
An "If/Then" statement is a predefined mechanical rule created before the trading session begins. For example, "If the price reaches X level, and prints Y pattern, then I will execute Z trade." This logical framework acts as a circuit breaker, preventing a trader from taking random, unplanned trades based on sudden market news.