PRO Trade Journal & Position Sizing Suite for Excel
⚡ Professional Trading Toolkit · For Microsoft Excel The PRO Trade Journal& Position Sizing Suite Track every trade, see exactly what's working, and size every position with confidence — in one Excel file you own forever. No subscriptions. No logins. No data ever leaves your computer. 1...


Everything included with your purchase
The PRO Trade Journal
& Position Sizing Suite
Track every trade, see exactly what's working, and size every position with confidence — in one Excel file you own forever. No subscriptions. No logins. No data ever leaves your computer.
Most traders don't blow up from bad entries.
They blow up because they never track their results and they risk too much per trade. You can't fix what you don't measure, and you can't grow an account you keep over-leveraging. This suite does both: a journal that does the math and shows you the truth, plus position-sizing calculators that tell you the exact size for every trade — across stocks, futures, forex, and crypto.
A journal that does the math — and tells you the truth
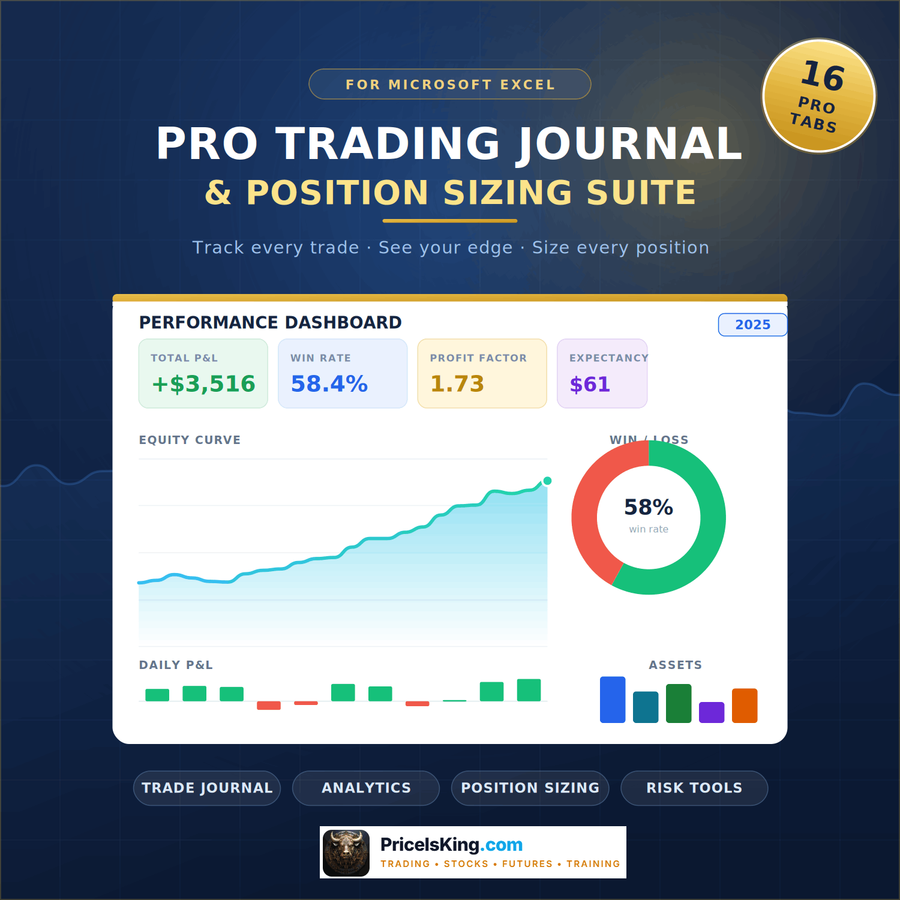
This is the heart of the suite. Log what you traded; it calculates the rest and turns your history into a clear, visual edge.
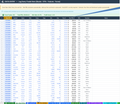
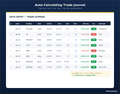
Log a trade in seconds. P&L calculates itself.
Enter your Side, Entry, Exit and Size and your Net P&L is calculated automatically — fees subtracted, Win/Loss tagged. No formulas to write.


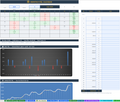
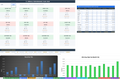
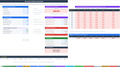
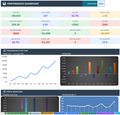
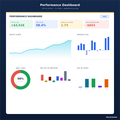
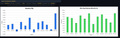
16 pro metrics & 11 charts — updated as you type
Your numbers visualized like a professional trading desk. Flip the year selector and the entire dashboard re-filters instantly.
Finally see which setups make money, where your drawdowns come from, whether your edge is long or short — and which emotions are quietly bleeding your account.
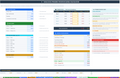
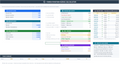
Green days, red days — at a glance
A color-coded monthly calendar with daily P&L, plus a daily profit/loss chart and a cumulative curve for the month you select. Pick any month/year and it redraws automatically.
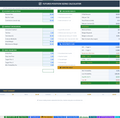
12 months, one screen
Every month's P&L, trade count, win/loss days, and best/worst day — color-coded with embedded charts, so your hot streaks and problem months jump out instantly.
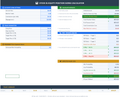
Never risk more than you planned again
Enter your account size and risk %. Get the exact number of shares, contracts, or lots — plus R:R, expected value, and your break-even win rate. Pure discipline, zero guesswork.
Stocks & Equities
Exact share count from risk %, entry & stop. Up to 3 targets, R:R, and Expected Value per trade.
Futures
Tick size, tick value & multiplier math for ES, NQ, MES, MNQ & more. Contract count + margin check.
Forex
Pip-value & lot sizing (standard / mini / micro) with a built-in major-pairs reference.
ATR-Based Sizing
Let the market's own volatility set your stop and size — the feature that separates pros from retail.
The math the pros run — done for you
Plan your account like a business, not a slot machine.
🔺 Scale-In / Pyramid
Add to winners with the right size at every leg — blended entry & true R:R auto-calculated.
📈 Growth Projector
Compounding over 500 trades across 3 scenarios with a live embedded chart.
📉 Drawdown Recovery
The exact % gain — and number of trades — it takes to climb back from any drawdown.
💀 Risk of Ruin
A 10×6 color-coded grid showing your probability of ruin — and a safe-zone finder.
🔥 Portfolio Heat
Track total open risk across up to 10 positions so you're never over-exposed.
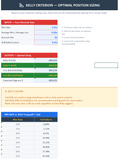
📐 Kelly Criterion
Mathematically optimal size from your win rate & payoff — Full and Half-Kelly, with a safety warning.
Your trading history is trying to tell you something.
Start logging today and let the dashboard reveal your real edge.
Get Instant Access →Every tab, explained. 16 tabs. Zero fluff.
Open it, change the blue cells, and every output updates instantly. No macros. No internet. No subscription. Just pure Excel.
🏠 Start Here — Navigator
A polished cover page that explains every tab and gets you to the right tool in seconds.
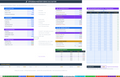
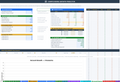
✍️ Data Entry — Trade Journal
Log a trade and Net P&L calculates itself from Side, Entry, Exit & Size — fees subtracted, Win/Loss tagged. 200 pre-formatted rows. Drop-downs for Asset, Side & Emotion.
📊 Analytics Dashboard
16 KPIs and 11 charts that update as you log — equity curve, drawdown, win rate, long vs short, day-of-week edge, P&L distribution, plus emotion and asset-class breakdowns. Year selector re-filters everything instantly.
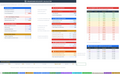
📅 Monthly P&L Calendar
Auto-builds for any month/year — green tiles for winning days, red for losing days, with weekly totals, a daily P&L chart and a cumulative curve for the selected month.
🗓 12-Month Year View
All 12 months on one page — P&L, trade count, win/loss days, win rate, and best/worst day, color-coded, with embedded monthly P&L and win-rate charts.
📊 Stocks & Equities Calculator
Account size, risk %, entry, stop & up to 3 targets → exact share count, position value, commission impact, R:R per target, break-even win rate, and Expected Value.
📈 Futures Calculator
Tick size, tick value, multiplier & margin math → exact contract count, notional value, margin vs. account, max contracts, and full R:R. Built-in reference for 25+ contracts.
💱 Forex Calculator
Pip-value & lot sizing for standard, mini and micro lots, with a built-in major-pairs reference and a "how pip value works" explainer.
📡 ATR-Based Position Sizing
Set your stop automatically from Average True Range instead of a guessed level. Built-in ATR calculator, a 1×–3× multiplier sensitivity table, and a volatility read. Stocks + futures.
🔺 Scale-In / Pyramid Calculator
Up to 5 entries with individual stops → blended entry, total risk across all legs, blended R:R, and P&L at target or stop. Includes 6 pyramid methods + a 7-rule safety checklist.
📈 Compounding Growth Projector
Project account growth over 500 trades across conservative, base & aggressive scenarios with a live chart. Trades-to-2×/10×, milestone tracker, and a 3-scenario comparison.
📉 Drawdown Recovery Calculator
A −25% drawdown needs +33% to recover; −50% needs +100%. See the exact math, trades-to-recover at your win rate, streak probability, and recommended loss limits.
💀 Risk of Ruin Calculator
The probability your account hits ruin before your goal, with a full 10×6 color-coded sensitivity grid (win rate 30–75% vs. risk 0.5–3%), stress tests, and a safe-zone finder.
🔥 Portfolio Heat Monitor
Track up to 10 open positions; total heat auto-calculates in $ and % with ✓ OK / MODERATE / ⚠ HIGH / 🚨 OVER-LIMIT status — so you're never accidentally over-leveraged.
📐 Kelly Criterion
The mathematically optimal position size from your win rate & payoff ratio — Full and Half-Kelly in dollars, a reference table, and an honest "when not to use it" warning.
📖 Futures Contract Specs Reference
Quick-reference for 25+ contracts across 6 categories — Equity Index, Energy, Metals, Rates, Ag, and FX — with tick sizes, values, multipliers and margin estimates.
How it stacks up
vs. the typical single-sheet sizing calculator
| Feature | Typical Tools | PIK PRO Suite |
|---|---|---|
| Auto-calculating trade journal | ✗ | ✓ |
| 16-metric analytics dashboard | ✗ | ✓ |
| Emotion & asset-class analysis | ✗ | ✓ |
| Basic share / contract sizing | ✓ | ✓ |
| Futures contract + tick math | ✗ | ✓ |
| Forex pip / lot sizing | ✗ | ✓ |
| ATR-based stop sizing | ✗ | ✓ |
| Risk of Ruin calculator | ✗ | ✓ |
| Drawdown recovery math | ✗ | ✓ |
| Scale-in / pyramid sizing | ✗ | ✓ |
| Portfolio heat monitor | ✗ | ✓ |
| Compounding projector + chart | ✗ | ✓ |
| P&L calendar + year view | ✗ | ✓ |
| Kelly Criterion | ✗ | ✓ |
| No subscription / no login | ✓ | ✓ |
Built for serious traders at every level
Day Traders
Futures & stocks — size every trade before the bell rings.
Swing Traders
Proper risk across your portfolio over days and weeks.
New Traders
Learn professional risk management from day one.
Prop / Funded
Protect funded accounts with drawdown limits & heat tracking.
One download. Instant access. Yours forever.
Everything included with your purchase:
✓ Single .xlsx file — no install, no macros, no cloud
✓ Works in Excel 2016+, Excel 365, Windows & Mac
✓ 16 fully-formatted, light-theme worksheets
✓ Every output is a live formula — zero formula errors
✓ Pre-loaded sample data so results show immediately
✓ Blue input cells clearly identified throughout
✓ No internet connection required after download
✓ Personal-use license · instant digital delivery
FAQ
Yes. Enter your side, entry, exit and size and the Net P&L is calculated for you, with fees subtracted and Win/Loss tagged. Works for stocks, ETFs, forex and crypto out of the box (for futures you can factor in your contract's point value).
No. Every input cell is highlighted in blue — you change the blue cells and everything else calculates automatically. A Start Here tab explains every sheet. Most traders are up and running in about 5 minutes.
No. It's a standard .xlsx for Microsoft Excel 2016+ (Windows or Mac) or Excel 365 — no macros, no add-ins, no internet after download. Google Sheets isn't recommended; some formatting and chart features may not render correctly.
Completely. Everything lives in your spreadsheet on your computer. Nothing is uploaded, tracked, or shared.
One-time purchase. You download the file and it's yours permanently — no monthly fees, no login, no expiry.
This is a digital download, so all sales are final once the file has been delivered — see our Return Policy. If you have any trouble accessing your download, contact us and we'll make it right.
Stop guessing. Start sizing — and tracking — correctly.
Track every trade. Size every position. See your real edge. It's all in one file.
Get Instant Access →Digital Goods: All sales of digital products are final. Once a download link has been generated or the product delivered, the transaction is considered complete. Disclaimer: PriceIsKing.com is a brand of Vulture Data Solutions Inc. This product is an educational and organizational tool, not financial, investment, or trading advice. Trading futures, forex, options and other instruments carries substantial risk and is not suitable for every investor; you can lose more than your initial investment. Past performance is not indicative of future results. Any figures shown are illustrative samples. See our Full Risk Disclosure.