
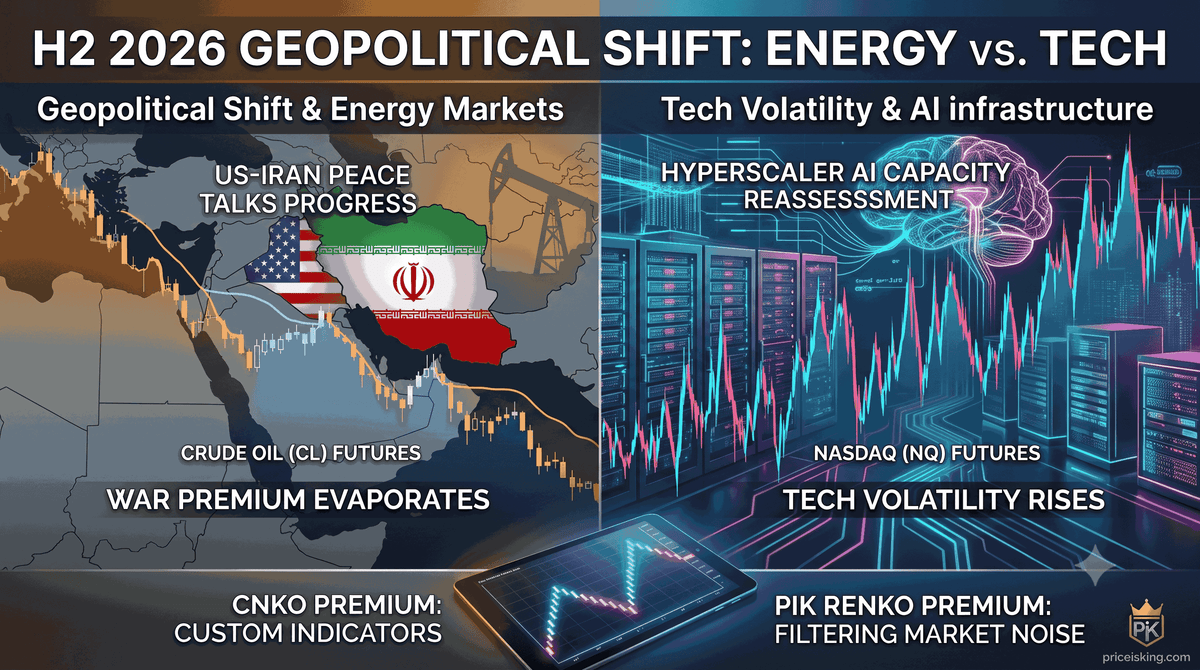
The second half of 2026 is opening with a violent divergence that has completely broken standard intermarket correlations. On one side of the floor, an unexpected breakthrough in US-Iran diplomatic talks has immediately stripped the geopolitical risk premium from energy, sending Crude Oil (CL) into a steep liquidation phase as algorithms price in millions of barrels of impending supply. Simultaneously, the tech-fueled bull market is hitting its most significant structural speed bump in years. Tier-1 hyperscalers are quietly shifting from aggressive, unconstrained infrastructure buildouts to rigorous capacity optimization, triggering massive intraday rotations and two-way volatility in the E-mini Nasdaq (NQ). For futures traders, this means the clean, momentum-driven trends of the past two quarters have dissolved into a choppy, headline-driven environment where standard technical indicators are actively trapping retail capital.
Quick Answer The H2 2026 market shift requires separating macro noise from structural order flow. Crude oil is in a supply-driven markdown phase, while the Nasdaq is experiencing massive institutional sector rotations. Traders must abandon lagging, time-based indicators and deploy price-driven charting structures to identify true institutional entry blocks and avoid getting swept by news-driven algorithms.
How are the US-Iran peace talks fundamentally restructuring Crude Oil (CL) order flow?
Crude oil doesn't trade on current inventory numbers alone; it trades on the anticipation of future supply shifts. For the past several quarters, a sustained geopolitical risk premium was structurally baked into every barrel of CL futures. The sudden progress in diplomatic negotiations has dismantled that premium in a matter of sessions. When institutions realize that global supply lines face expansion rather than disruption, the structural buying floor completely drops out.
Looking closely at the order book during these drops reveals a distinct footprint: large institutional sell orders are layering the ask, while bid depth is incredibly thin. This imbalance creates swift, cascading flush-outs. Retail traders who attempt to buy the support levels of last month find themselves trapped in a continuous markdown phase. In a supply-driven regime shift, old technical support levels mean nothing to an algorithm tasked with unloading thousands of contracts.
To trade this safely, you have to treat every minor intraday rally as short-covering rather than true structural buying. The institutional tape is selling the rips, which means your focus must remain entirely on identifying the exact exhaustion points of these counter-trend bounces to position yourself short with the macro flow.
Why are hyperscaler AI infrastructure reassessments causing structural failure in NQ trends?
The Nasdaq’s historic run was built on a very simple narrative: endless, unconstrained capital expenditure into AI data centers and hardware. However, the market is a forward-looking discounting mechanism. As hyperscalers begin entering an audit and optimization phase—checking actual utilization rates and return on investment before cutting the next massive check for data center expansions—the underlying momentum shifts from institutional accumulation to distribution.
This shift does not mean the tech sector is collapsing, but it completely changes how the NQ handles intraday liquidity. Instead of steady, one-way upward trends, we are seeing violent, two-way rotations. Money is actively fleeing overextended semiconductor and hardware names and hiding in defensive value pockets.
On your charts, this manifests as incredibly messy trading ranges. The NQ will frequently sweep the previous day's high to trap breakout buyers, immediately reverse 150 points to sweep the session lows, and then close the day precisely where it opened. If you try to trade these ranges using traditional breakout patterns, you will constantly find yourself buying the absolute top and selling the absolute bottom.
The failure of time-based indicators: Why standard moving averages get shredded in macro rotations
During a heavy macro news cycle, time-based charts (like the 5-minute or 15-minute intervals) become highly unreliable. A time-based chart forces a new candle to print every few minutes, completely blind to whether the market just traded 50,000 contracts or 50 contracts. When headline risk is elevated, algorithmic market makers instantly widen their spreads, causing price to gap violently across thin volume pockets.
If you are relying on indicators like the 20 EMA or MACD on a time chart, you are using mathematics calculated on completely distorted data. A single news flash can cause a massive candle that instantly crosses your moving averages, giving a false signal just as the initial panic momentum exhausts. By the time the moving average crossing confirms the "trend," the smart money is already reversing the trade.
To protect your capital in H2 2026, you must stop letting an arbitrary clock dictate your chart layout. Markets move based on transactions, volume, and price structural changes—none of which care about the passing of a five-minute interval.
How can price-action filtering expose institutional liquidity pools?
The secret to navigating a headline-driven market is filtering out the noise so you can see exactly where real institutional capital is participating. This requires professional tools built specifically for NinjaTrader 8 that track pure price progression rather than time duration.
When you filter out time, a market that is violently swinging back and forth in a tight, news-driven panic looks entirely different. The chart stops printing meaningless noise and only moves when price actually breaks a structural threshold.
By utilizing an advanced framework like the PIK Renko Premium indicator, you completely change how you view volatile order books. Instead of a chaotic mess of overlapping wicks, you see distinct, clear structural bricks. If the NQ spikes up and down on a headline but fails to make a structural price commitment, your chart remains calm and neutral. This mechanic alone saves traders thousands of dollars in unnecessary commissions and emotional paper cuts during news releases.
Executing the game plan: High-probability setups for CL and NQ this quarter
To successfully extract points from this environment, you must apply separate, specific rules to energy and technology.
For Crude Oil (CL): Accept that the macro path of least resistance is heavily weighted to the downside. Your playbook should center on identifying pullbacks into key VWAP levels or prior session volume points. Wait for an intraday bounce to push into these resistance areas, look for order flow exhaustion on your custom price bars, and short the failure. Keep your targets conservative, as short-covering rallies in oil can be sudden, but do not fight the primary downward structural trend.
For the Nasdaq (NQ): Treat the market as a range-bound distribution environment until proven otherwise. The highest-probability setups are found outside the value area. Let the initial morning volatility sweep above the opening range or yesterday's high. Once the liquidity is taken, look for your custom charting bricks to flip bearish, confirming that the institutions have finished trapping retail buyers and are actively pushing the price back into the value area. This mean-reversion strategy keeps your risk incredibly tight and aligned with algorithmic behavior.
Frequently Asked Questions
Why are the US-Iran peace talks causing oil prices to fall so rapidly?
Progress in diplomatic talks removes the geopolitical risk premium that traders bake into futures contract pricing. The anticipation of Iranian oil safely returning to global supply chains shifts the forward outlook from supply deficit to supply surplus, triggering rapid institutional selling.
What does an AI infrastructure capacity assessment mean for tech stocks?
It signals a transition from speculative, unchecked capital spending to optimization and efficiency monitoring. While long-term adoption remains strong, this near-term pause in massive infrastructure expansion causes institutions to trim overextended tech holdings, creating two-way volatility in the NQ.
How do algorithmic trading systems exploit retail traders during macro news events?
Algorithms quickly pull liquidity from the order book when headlines hit, causing wide price gaps. They are programmed to run price to highly visible technical levels—like prior day highs or lows—to trigger retail stop-loss clusters and execute institutional orders at highly favorable prices.
Why should I avoid using standard time-based moving averages right now?
Time-based moving averages respond to chronological intervals rather than real transactional volume. In volatile, news-driven markets, a sharp price movement can generate lagging crossover signals that trap traders into entries right as the move is structurally ending.
How does the PIK Renko Premium indicator filter out headline market noise?
PIK Renko Premium operates entirely independent of time. It only prints a new brick when price cleanly breaches a verified threshold. If a news headline causes erratic, back-and-forth price swings without a structural breakout, the chart remains completely unchanged, shielding you from false signals.
What is the optimal risk management approach for trading NQ futures ranges?
The best approach is to risk capital exclusively at outer liquidity edges using strict invalidation points. Wait for price to sweep an established high or low, look for immediate structural rejection on your price bars, and set your protective stop just past the exact exhaustion wick.