
PIK VWAP Pro — The Complete User Guide
Anchored VWAP with volume-weighted deviation bands for MNQ, NQ & ES traders

VWAP — the Volume Weighted Average Price — is one of the most-watched reference lines in intraday futures trading. It tells you the true average price the market has paid, weighted by how much volume traded there. Institutions lean on it, algos respect it, and price has a habit of reacting to it.
PIK VWAP Pro takes that reference line and gives you three things a basic VWAP plot won't: your choice of where the calculation starts (session, weekly, or a manual anchor you set yourself), a set of volume-weighted standard-deviation bands that map out how stretched price is from fair value, and a clean, customizable visual layer of shaded zones so you can read the whole picture at a glance.
This guide walks through every setting and every zone on the chart, then shows you how traders actually put it to work. If you're on MNQ, NQ, ES, or trading a funded account, this is built for your workflow.
Get PIK VWAP Pro for NinjaTrader 8
Instant download the moment your order clears — no waiting.
Buy PIK VWAP Pro →Instant Download & Install
As soon as your purchase is complete, your download is available immediately from your order confirmation and email — there's no manual delivery and nothing to wait for. Installing into NinjaTrader 8 takes under a minute:
- Download the PIK VWAP Pro file from your confirmation email or account.
- In NinjaTrader, open the Control Center and go to Tools → Import → NinjaScript Add-On…
- Select the downloaded file and let NinjaTrader import it.
- Open a chart, right-click → Indicators, find PIKVWAPPro in the list, and add it.

Activating Your License (Machine ID)
PIK indicators are licensed to your machine. To fully activate PIK VWAP Pro, you'll send us your NinjaTrader Machine ID so we can register your license. This is a quick, one-time step:
- Find your Machine ID in NinjaTrader (Control Center → Help → About, or as shown on the activation page).
- Submit it through our activation form using the link below.
- Once processed, your indicator is fully unlocked on that machine.
Reading the Chart: What Every Line & Zone Means
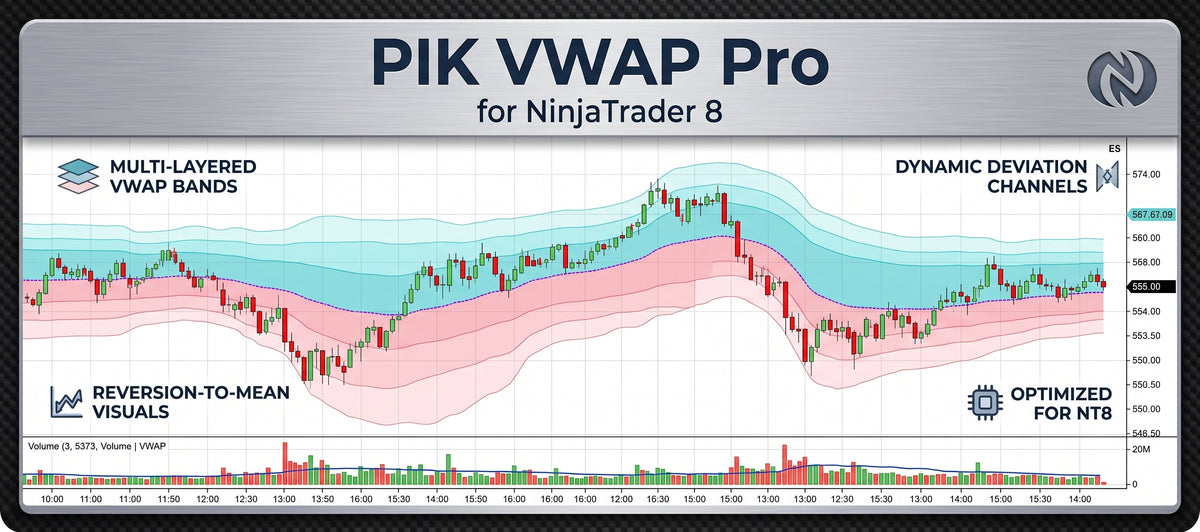
Once applied, PIK VWAP Pro draws a layered picture around fair value. Here's what each element is:

This is the core value — the volume-weighted average price since the anchor point. It uses each bar's typical price (High + Low + Close ÷ 3) weighted by that bar's volume. Price trading above it means buyers have, on average, paid up; below it means sellers have controlled the average. It's your intraday line in the sand.
These sit above VWAP at one, two, and (optionally) three standard deviations. They mark how far price has stretched above fair value. The further out you go, the more statistically extended the move.
The mirror image below VWAP — one, two, and optionally three deviations down. They frame how far price has dropped below the volume-weighted average.
The soft color fills between the lines make the structure readable without squinting. The zone nearest VWAP is the strongest shade and each band outward fades lighter, so your eye instantly registers how deep into the deviation range price currently sits.
The Three Anchor Modes
This is where PIK VWAP Pro earns its "Pro." The Anchor setting controls the single most important thing about any VWAP: where the calculation begins. You get three modes.
Resets at the start of each trading session. This is the classic intraday VWAP most traders expect. Each new session begins a fresh calculation, so the line and bands reflect only today's auction. Best for day traders who treat every session as a clean slate.
Resets at the start of each week. The calculation runs continuously across all sessions in the week, giving you a broader reference that swing-oriented intraday traders use to judge where price sits relative to the whole week's activity — not just today's.
Starts from a specific date and time you choose. Set the Manual anchor time and the indicator draws nothing until that moment, then builds the VWAP and bands forward from there. This is the power-user's tool — anchor to a major news release, an economic print, a session open, an overnight high/low, or the exact bar where a big move started, and measure fair value from that event onward.
The Deviation Bands: Setup & Meaning
You control up to three band pairs, each independently toggled and each with its own multiplier. Out of the box, PIK VWAP Pro ships with Band 1 and Band 2 on, Band 3 off, at the standard multiples:
- Band 1 — multiplier 1.0: one standard deviation from VWAP. Price spends a lot of time inside this inner zone; touches here are routine, not extremes.
- Band 2 — multiplier 2.0: two standard deviations. Reaching here means price is meaningfully stretched from fair value — the zone many mean-reversion traders watch.
- Band 3 — multiplier 3.0 (off by default): three standard deviations. A statistically rare stretch. Turn it on if you want to flag the true extremes.
You can change any multiplier to fit your instrument and timeframe. Trading a fast, high-range instrument? You might widen the multiples. Prefer tighter reference zones? Pull them in. Each band pair is Show on/off and multiplier adjustable.
Customizing the Visuals
PIK VWAP Pro is built to sit cleanly on any chart theme:
- Fill opacity (%) — controls how strong the shaded zones appear. The default is a subtle 16%, enough to read structure without drowning your candles. Push it higher for bolder zones or lower for a minimalist look.
- Above-VWAP fill — the color used for the zones above VWAP (teal by default).
- Below-VWAP fill — the color used for the zones below VWAP (red by default).
Match them to your brand or theme, or keep the defaults — the outward-fading opacity is applied automatically so the nearest zone always reads strongest.
Full Settings Reference
Every adjustable input, grouped exactly as you'll see it in the indicator dialog:
| Setting | Group | What it does |
|---|---|---|
| Anchor (0=Session 1=Weekly 2=Manual) | Anchor | Sets where the VWAP calculation begins. |
| Manual anchor time | Anchor | The date/time the VWAP starts from when Anchor is set to Manual (2). |
| Show band 1 | Bands | Toggles the first deviation band pair on/off (default: on). |
| Band 1 multiplier | Bands | Standard-deviation multiple for Band 1 (default: 1.0). |
| Show band 2 | Bands | Toggles the second band pair on/off (default: on). |
| Band 2 multiplier | Bands | Standard-deviation multiple for Band 2 (default: 2.0). |
| Show band 3 | Bands | Toggles the third band pair on/off (default: off). |
| Band 3 multiplier | Bands | Standard-deviation multiple for Band 3 (default: 3.0). |
| Fill opacity (%) | Visuals | Strength of the shaded zones, 0–100 (default: 16). |
| Above-VWAP fill | Visuals | Color of the zones above VWAP. |
| Below-VWAP fill | Visuals | Color of the zones below VWAP. |
How Traders Use PIK VWAP Pro
Here are three common ways traders read the tool. These are illustrations of how the indicator is interpreted — not signals or recommendations. Always apply your own plan and risk management.
Traders use the VWAP line itself as a directional reference: sustained trade above it frames a bullish intraday bias, below it a bearish one. Many treat pullbacks toward VWAP as the market re-testing fair value.
The bands frame how extended price is. A push into the Band 2 or Band 3 zone highlights a statistically stretched move — the areas mean-reversion traders watch for a snap back toward VWAP, and where trend traders watch to see whether momentum can hold beyond the extreme.
Using Manual mode, traders anchor VWAP to a specific catalyst — a CPI or FOMC release, the RTH open, or the start of an overnight range — to measure exactly how the market has valued that instrument since the event that matters to them.

Advanced: Feed the VWAP Into Your Own Tools
PIK VWAP Pro exposes its calculated VWAP value as a data series, which means it isn't just something you look at — it's something you can build on. Because it's registered for NinjaTrader's indicator, Market Analyzer, and Strategy layers, you can:
- Reference the live VWAP value inside your own custom indicators.
- Pull it into a Market Analyzer column to monitor price-vs-VWAP across a whole watchlist at once.
- Use it as an input to a NinjaScript strategy — for example, gating entries on which side of VWAP price is trading.
Most VWAP add-ons keep this locked inside the drawing layer. PIK VWAP Pro hands you the number.
Ready to add it to your charts?
PIK VWAP Pro for NinjaTrader 8
Instant download at checkout. Activate in minutes with your Machine ID.
Buy Now → Activate License →Risk disclaimer: PIK VWAP Pro is an analytical charting tool for NinjaTrader 8. It is provided for informational and educational purposes only and does not constitute financial, investment, or trading advice, nor a recommendation to buy or sell any instrument. Trading futures and other leveraged products involves substantial risk of loss and is not suitable for every investor. No indicator predicts future price movement, and past performance is not indicative of future results. You are solely responsible for your own trading decisions and risk management. PriceIsKing.com is a product of Vulture Data Solutions Inc.