
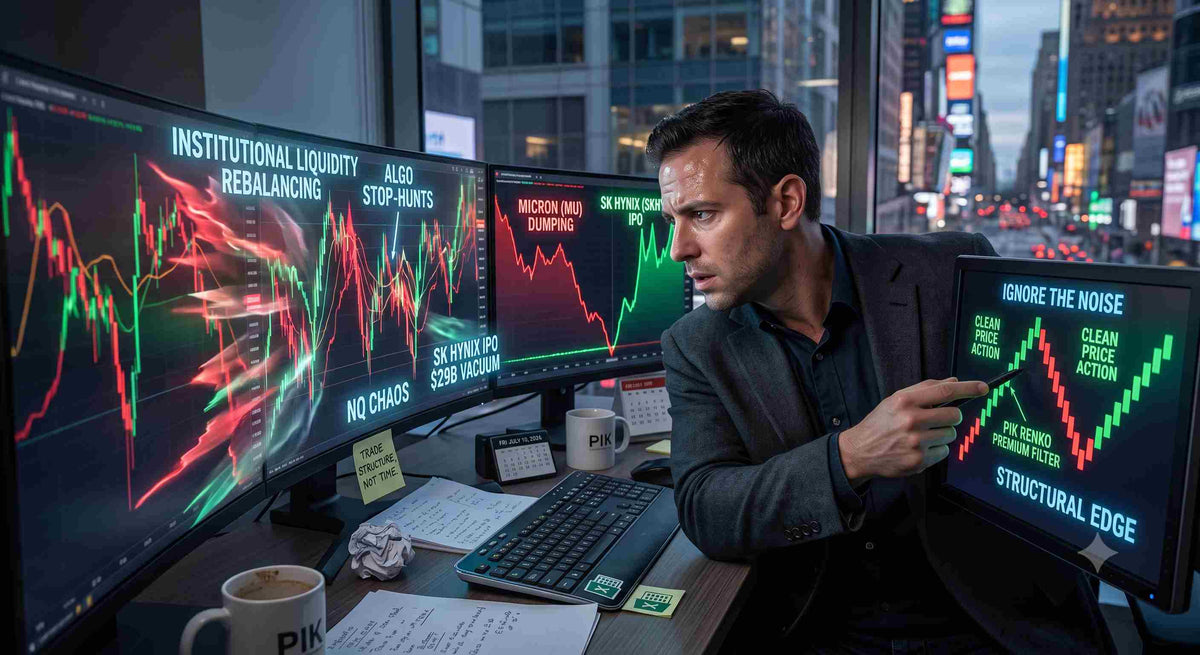
Happy Friday, July 10, 2026. If you woke up this morning, poured your coffee, and expected a gentle, relaxing end to the trading week, the Nasdaq (NQ) would like a word with you. Today, the market is digesting the absolute behemoth that is the $29 billion SK Hynix (SKHY) IPO. As the largest foreign U.S. listing in history hits the tape, it isn't just making a splash—it is actively sucking the liquidity out of the rest of the semiconductor sector like a financial black hole. Institutional managers are being forced to aggressively dump shares of established players like Micron (MU) just to free up the capital required to meet their new SK Hynix allocations. The result? The E-mini Nasdaq futures are currently trapped in a violent, algorithmic washing machine. If your current trading strategy involves staring at a 3-minute chart and praying for a clean trend to emerge, you aren't trading; you are just volunteering to fund an institutional algorithm's weekend Hamptons trip.
Quick Answer The $29B SK Hynix IPO is forcing massive institutional rebalancing across the tech sector, creating erratic liquidity vacuums and algorithmic stop-hunts in NQ futures. To survive, traders must abandon time-based charts on retail platforms and utilize price-action filters on NinjaTrader 8 to block out the noise and trade genuine institutional momentum.
What exactly happens to NQ liquidity during a $29B mega-IPO?
To understand why your chart looks like a barcode that was fed through a woodchipper today, you have to understand the mechanics of institutional rebalancing. When a company with a $29 billion valuation drops onto the Nasdaq, the big players—mutual funds, index-tracking ETFs, and pension funds—are legally obligated to buy it to maintain their sector weightings. But they don't have billions of dollars in cash just sitting in a checking account waiting to be deployed.
To buy SK Hynix, they have to sell something else. Today, that "something else" is heavily concentrated in rival semiconductor stocks like Micron. This creates a massive, asynchronous tug-of-war within the Nasdaq index. You have aggressive, forced institutional selling in one pocket of the tech sector, battling against dip-buyers and index rebalancers in another.
On the futures tape, this translates to a severe lack of continuous directional liquidity. The NQ will break out by 30 points, convincing every retail trader that the rally is on, only to immediately slam into a massive institutional sell block of MU shares, causing the index to violently reverse 40 points in the opposite direction. The algorithms aren't doing this to be malicious; they are just executing block orders. But if you are caught in the crossfire without a structural edge, you will be chopped to pieces.
Why are standard moving averages on Thinkorswim getting shredded today?
Thinkorswim is a fantastic platform for analyzing options flow, building long-term portfolios, and swinging equities. But attempting to day trade the NQ during an IPO-induced liquidity crisis on a standard 3-minute or 5-minute TOS chart is the definition of insanity.
The fundamental flaw with time-based charts during extreme volatility is that time does not equal volume or participation. A 5-minute candle will print exactly every five minutes, whether the market traded 10,000 contracts or 10 contracts during that window. During today's SK Hynix rotation, high-frequency trading (HFT) algorithms are rapidly pulling their limit orders from the book to avoid risk, which widens the bid-ask spread. When a market order sweeps through that thin order book, price gaps instantly, leaving behind massive, terrifying wicks on your screen.
Because moving averages—like your favorite 9 EMA or 21 SMA—are calculated based on the closing price of these distorted time candles, they become hopelessly lagged. An algorithmic sweep will trigger a "golden cross" on your MACD, prompting you to go long. Three seconds later, the algorithm completes its liquidity hunt, reverses, and sends price tumbling right through your stop-loss. By relying on time, you are acting on data that the smart money has already abandoned.
The dark arts of Capital Rotation: How institutional algorithms hide in the chop
Institutions do not execute trades the way retail traders do. If a fund needs to offload $500 million worth of semiconductor exposure, they don't hit the "sell market" button and crash the index. They use Time-Weighted Average Price (TWAP) and Volume-Weighted Average Price (VWAP) algorithms to quietly distribute their shares throughout the trading session.
These algorithms are specifically programmed to hide inside retail momentum. When the NQ naturally drifts upward to a key resistance level and retail breakout traders start buying, the institutional algorithm steps in and unloads its inventory into that buying pressure. Once the retail buying is exhausted, the algo steps away, and the market drops back down to the bottom of the range.
This is what creates the dreaded "Friday Chop." The market isn't trending; it is just a giant processing facility for institutional distribution and accumulation. If you don't have a way to filter out the noise and visualize this structural ping-pong game, you will endlessly buy the top and sell the bottom until your daily loss limit locks you out of your account.
Why is NinjaTrader 8 the only logical sanctuary from IPO volatility?
To survive a tape that is being heavily manipulated by index rebalancing, you have to stop speaking the language of time and start speaking the language of structure. This requires migrating your intraday futures operations to a professional-grade platform. Simply put, NinjaTrader 8 is engineered specifically for these exact hostile environments.
Unlike standard retail brokers, NT8 allows you to build completely custom, non-time-based data series natively within its engine. You are not forced to watch a 5-minute clock tick down. Instead, you can load up tick charts, volume charts, or range charts, which only print new data on your screen when a specific amount of real market participation actually occurs. When the algorithms cause the NQ to violently thrash in a 10-point range for twenty minutes, a time-based chart will print dozens of chaotic, confusing candles. A properly configured chart on NinjaTrader 8 might not print a single new bar, effectively hiding the noise and keeping your finger off the mouse.
Furthermore, NT8’s direct order routing capabilities ensure that when you finally do pull the trigger on a valid setup, your order bypasses the retail lag and hits the exchange with minimal latency—a critical feature when trading a market as fast as the NQ on an IPO day.
How does the PIK Renko Premium indicator filter out algorithmic deception?
Having the right platform is step one; having the right analytical filter is step two. If you truly want to stop getting faked out by algorithmic liquidity sweeps, you need a charting setup that demands proof before it moves. This is where integrating the PIK Renko Premium indicator becomes your ultimate structural weapon.
Renko charts are completely indifferent to time. They are built entirely on predefined price movements (bricks). For example, if you set your Renko brick size to 10 ticks, a new brick will only form when the price moves a full 10 ticks in a single direction.
On a day like today, where the SK Hynix rotation is causing the NQ to spike up and down aggressively within a 30-point range, standard candlestick charts will show massive, overlapping wicks that look like a heart monitor during a panic attack. The PIK Renko Premium chart? It will simply print a smooth series of alternating red and green bricks, explicitly showing you that the market is stuck in a box. It removes the emotion from the chart. It prevents you from seeing a false breakout and clicking "Buy Market," because the Renko brick refuses to close until the price actually commits to the trend. It is the ultimate antidote to FOMO (Fear Of Missing Out).
The Friday Afternoon trap: Why your psychology breaks down during market rotations
Let's have an honest conversation about trader psychology on a Friday. You have been staring at screens all week. You might be down a few hundred bucks, and you desperately want to go into the weekend with a green PnL. The clock hits 1:30 PM EST, the volume begins to dry up as European markets have long closed, and the NQ enters a mind-numbing, slow-motion rotation.
This is the exact moment where 80% of retail traders destroy their accounts. Out of sheer boredom and a stubborn refusal to accept a small loss for the week, they begin forcing trades. They see a minor 5-point blip on the NQ and convince themselves it is the start of a massive afternoon squeeze. They enter a position, the algorithms immediately fade the move, and they get stopped out. Frustrated, they double their position size and reverse directions, only to get stopped out again as the market returns to the middle of the range.
This cycle of revenge trading is entirely avoidable. When you rely on structured tools rather than your own impatient intuition, the market rules dictate your actions. If your custom Renko chart is flat and chopping sideways, the system is literally telling you to walk away, go outside, and start your weekend early. Real professionals know that preserving capital during a choppy Friday rotation is far more profitable than trying to extract pennies from a random number generator.
The definitive game plan for day trading index futures during a mega-IPO
If you are absolutely determined to trade the NQ today, you need a rigid set of rules to protect your capital from the SK Hynix rebalancing waves. Follow this institutional playbook:
- Step 1: Sit out the opening drive. The first 30 to 45 minutes of the session will be pure chaos as the ETF providers execute their forced selling of secondary semiconductor stocks. Do nothing. Just watch.
- Step 2: Define the algorithmic battlefield. After the first hour, the market will establish a clear Initial Balance (the high and low of the morning session). Draw hard lines at these extremes. The area between these lines is the chop zone.
- Step 3: Wait for the liquidity sweep. Algorithms love to push the price just past the Initial Balance extremes to trigger retail stop-losses before reversing. Wait for the market to poke its head outside the range and immediately fail.
- Step 4: Confirm with price action, not time. When the false breakout happens, ignore your 3-minute chart. Look exclusively at your PIK Renko chart. Wait for a definitive color change (e.g., a strong bearish brick closing back inside the range).
- Step 5: Execute with a hard stop. Enter the trade targeting a return to the middle of the range (the Volume Point of Control). Place your stop loss exactly one tick above the wick of the false breakout. If you are wrong, you lose a tiny fraction of your account. If you are right, you ride the institutional reversion back to the mean.
Trading during a massive liquidity event isn't about guessing the direction of the trend; it's about identifying where the algorithms are trapping impatient traders, and positioning yourself to profit from their panic. Upgrade your tools, respect the risk, and let the structure dictate your execution.
Frequently Asked Questions
What is a mega-IPO and how does it affect the Nasdaq?
A mega-IPO, like the $29 billion SK Hynix debut, forces massive index-tracking funds to buy the new stock. To free up capital, they aggressively sell existing holdings in similar sectors, causing highly erratic, non-directional volatility across the Nasdaq index.
Why do time-based charts fail during high market volatility?
Time-based charts print new candles based strictly on the clock, regardless of trading volume. During extreme volatility, this causes massive wicks and lagging indicator signals, tricking traders into entering positions long after the algorithmic move has exhausted itself.
Why is NinjaTrader 8 preferred over Thinkorswim for day trading futures?
While Thinkorswim is excellent for options, NinjaTrader 8 is a specialized futures platform that natively supports custom, non-time-based data series (like tick and Renko charts) and provides ultra-low latency direct order routing, which is critical for fast-moving markets.
How do Renko charts help traders avoid false breakouts?
Renko charts ignore time entirely and only print a new brick when a specific structural price movement is achieved. This filters out the chaotic, up-and-down tick noise of a choppy market, visually demanding that a trend prove itself before you take a trade.
What does it mean when institutional algorithms "hunt liquidity"?
Institutions use algorithms to push asset prices slightly beyond obvious support or resistance lines. This triggers the stop-loss orders of retail traders, providing a massive influx of liquidity (shares or contracts) that the institution can use to fill their own large block orders at favorable prices.
How can I stop overtrading on Friday afternoons?
Overtrading on Fridays is a psychological response to boredom and a desire to end the week "green." You can stop this by adopting rigid, non-time-based chart filters that visually show the market is ranging, and by enforcing a strict daily loss limit that physically locks your trading terminal.