
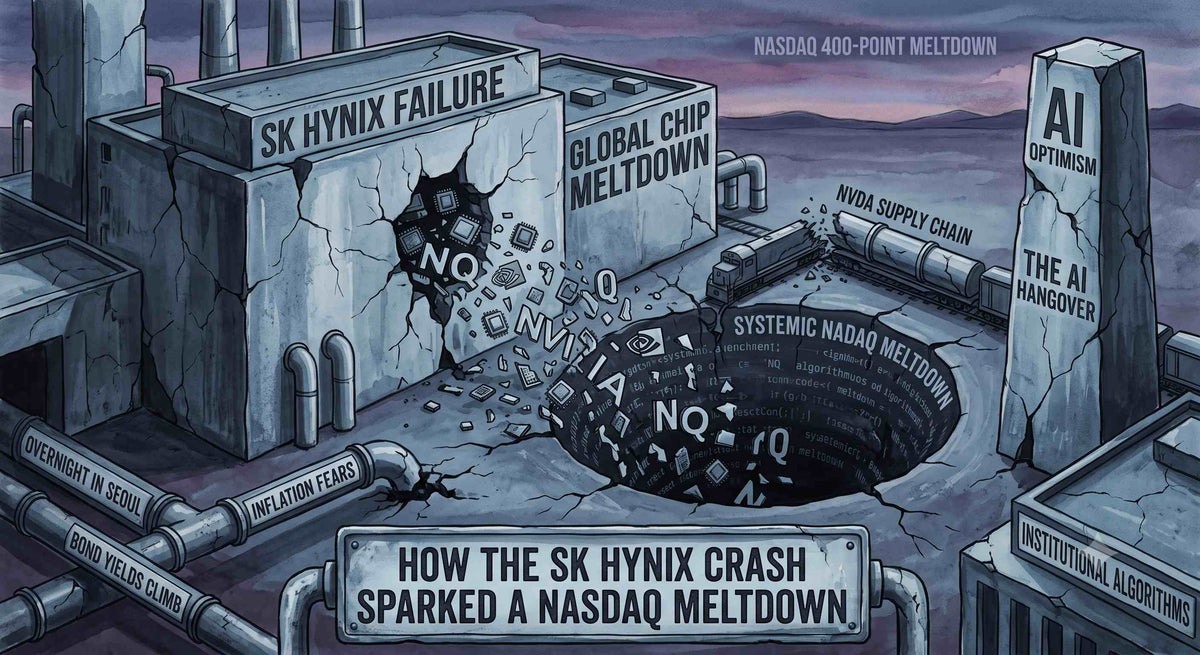
Welcome to Monday, July 13, 2026. If you spent your weekend relaxing and expected a calm, orderly market open this morning, the tech sector had a violently different plan for your account. The Nasdaq composite took an absolute beating today, plummeting a staggering 408.43 points—a brutal 1.6% drop led by a massive liquidation in semiconductor darlings like Nvidia and Micron. The catalyst for this tech hangover triggered overnight in Seoul, where SK Hynix stock suffered its largest single-day loss ever, sending shockwaves across global chip supply chains. Paired with a massive 10% geopolitical spike in crude oil over the weekend, inflation fears are back, bond yields are climbing, and institutional algorithms are aggressively dumping overextended tech names. If you spent the morning trying to "buy the dip" on a standard 5-minute time chart, your stop-losses were likely converted into instant institutional liquidity.
Quick Answer The Nasdaq's 1.6% plunge reflects systemic risk as macro inflation pressures align with a historic semiconductor sell-off. Day traders must step away from lagging, time-based candles and deploy clean price-action filters on NinjaTrader 8 to identify true institutional distribution levels and execute high-probability short continuations.
Why did the SK Hynix crash trigger a systemic liquidation in U.S. chip stocks?
The semiconductor market is a hyper-connected global ecosystem where a tremor in Asia instantly triggers an earthquake on Wall Street. When SK Hynix shares fell to their largest loss ever in Seoul overnight, it shattered the retail illusion that AI infrastructure spending is an unconstrained, permanent upward escalator. Institutional managers immediately realized that if the world's leading memory manufacturers are experiencing a severe pricing and demand reset, forward valuations for U.S. giants like Nvidia and Micron are severely mispriced.
When the New York bell rang, algorithmic execution programs didn't look at the individual fundamentals of Micron or Nvidia; they simply triggered cross-asset sell programs across the entire semiconductor sector. This type of basket selling creates a structural void in the order book. Bid depth evaporates entirely as market makers pull back their orders to assess the macro damage, leaving wide, untraded price gaps. If you were trading without an objective understanding of this global sector correlation, you were left guessing why perfectly good technical support levels were being sliced through like hot butter.
Why do time-based charts turn into retail death traps during panic liquidations?
When a major index like the NQ drops over 400 points in a single session, standard 1-minute, 3-minute, or 5-minute candlestick charts become actively dangerous to your financial health. A time-based chart forces a candle to close and a new one to print simply because the clock ticked forward 300 seconds. It is completely blind to the velocity of transactional order flow inside that window.
During today's steep sell-off, a 5-minute candle would frequently drop 60 points, bounce 20 points on temporary short-covering, and leave a massive lower wick. To a retail trader staring at a standard platform, that wick looks like "buying pressure." They immediately smash the buy button, assuming the bottom is in. Two minutes later, the next institutional sell block hits the tape, the bid-ask spread widens, and the price plummets another 80 points. Time-based charts manipulate your visual perception of momentum, tricking you into fighting a cascading waterfall because you are reading chronological noise instead of pure price progression.
How does the PIK Renko Premium indicator uncover the true trend direction?
To extract consistent points from a market in a state of systemic liquidation, you must aggressively strip time away from your technical layout. Professional futures day traders insulate themselves from algorithmic deception by deploying specialized price-based infrastructure. When you transition your primary data feeds over to NinjaTrader 8, you gain the native ability to completely bypass chronological candles.
By weaponizing the PIK Renko Premium indicator on your NQ workspace, the chaotic, headline-driven whiplash completely disappears. The indicator mandates that price must cleanly traverse a specific, objective tick threshold before a new brick is permitted to form.
During today's 400-point Nasdaq dump, while standard charts were printing a visually exhausting mess of alternating green and red candles with massive, overlapping wicks, the PIK Renko Premium display printed a beautifully clean, unbroken staircase of red bricks. It removes the psychological temptation to catch a falling knife by showing you that despite minor intraday bounces, the structural order flow remains aggressively dominated by institutional sellers. It forces you to wait for a verified structural shift before you ever risk a dime of capital.
How can you spot institutional distribution blocks before the market drops?
Smart money does not distribute millions of shares at the bottom of a drop; they distribute them into minor, retail-driven rallies. Today's price action offered a classic textbook example of this mechanism. After the initial morning flush, the NQ formed a temporary base and began drifting upward, retracing about 80 points. To the amateur crowd, this looked like a powerful recovery rally.
However, if you looked closely at the volume footprint at the top of that bounce, a massive institutional distribution block was clearly visible. The volume was expanding rapidly, but the price was completely failing to make higher highs. This is known as absorption—institutions were quietly absorbing every single retail buy order by unloading their massive inventory into the market. Once the retail buying power was completely exhausted, the algorithms pulled their bids, and the market instantly collapsed into another 150-point leg down. Learning to spot these structural distribution blocks is the exact dividing line between trading with an edge and functioning as retail exit liquidity.
Executing the bearish playbook: High-probability short entry mechanics
When a major index is down 1.6%, your primary goal must shift from predicting a bottom to safely joining the downward momentum on low-risk pullbacks. Do not chase the market when it is stretching to new session lows; wait for the rubber band to snap back.
The optimal execution strategy during a systemic tech liquidation involves a simple, four-step mechanical sequence. First, allow the NQ to sweep a minor intraday high to flush out early shorts. Second, wait for the price to slam directly into a premium volume node or the declining intraday VWAP. Third, check your PIK Renko Premium chart—demand to see the bricks cleanly flip back from green to red, confirming that institutional sellers have re-entered the arena. Finally, execute your short position with a protective stop placed precisely one tick above the swing high of the failed retest. This protocol keeps your risk strictly defined while positioning your account to capture the full weight of the primary institutional markdown phase.
Frequently Asked Questions
Why did the Nasdaq fall 1.6% today?
The Nasdaq plummeted 1.6% (over 408 points) due to a systemic global liquidation in semiconductor stocks sparked by a historic single-day drop in SK Hynix shares in Seoul, combined with mounting inflation fears from a weekend surge in crude oil prices.
How does an overnight stock crash in Seoul affect U.S. futures?
Because global technology and AI supply chains are deeply interconnected, a historic crash in a major microchip producer like SK Hynix forces institutional global fund managers to instantly de-risk and rebalance their portfolios, triggering automated sell blocks in U.S. equivalents like Nvidia and Micron.
Why are time-based candlestick charts dangerous during market panics?
Time-based charts print candles at fixed chronological intervals regardless of volume or execution speed. During panic selling, this lag creates deceptive candlestick wicks and lagging indicator crossovers that trick retail traders into buying false bottoms right before another liquidation wave.
How do custom Renko bars isolate the true market trend?
Renko bars operate completely independent of time, only rendering a new brick when a specific, pre-defined price movement occurs. This mechanics filters out the back-and-forth noise of high-frequency algorithms, providing a clean visual map of true directional order flow.
What is institutional absorption during a market drop?
Institutional absorption occurs when large funds use retail-driven counter-trend rallies to quietly distribute their massive inventory. They place hidden sell orders that absorb all incoming buy orders, preventing price from advancing before triggering the next leg down.
Can I run advanced price-action filters like PIK Renko Premium on retail platforms?
Standard retail web brokers or charting packages generally lack the internal processing architecture to handle complex, tick-by-tick non-time-based data filtering. Professional-grade indicators like PIK Renko Premium require specialized, futures-first platforms like NinjaTrader 8 to operate with zero-latency precision.